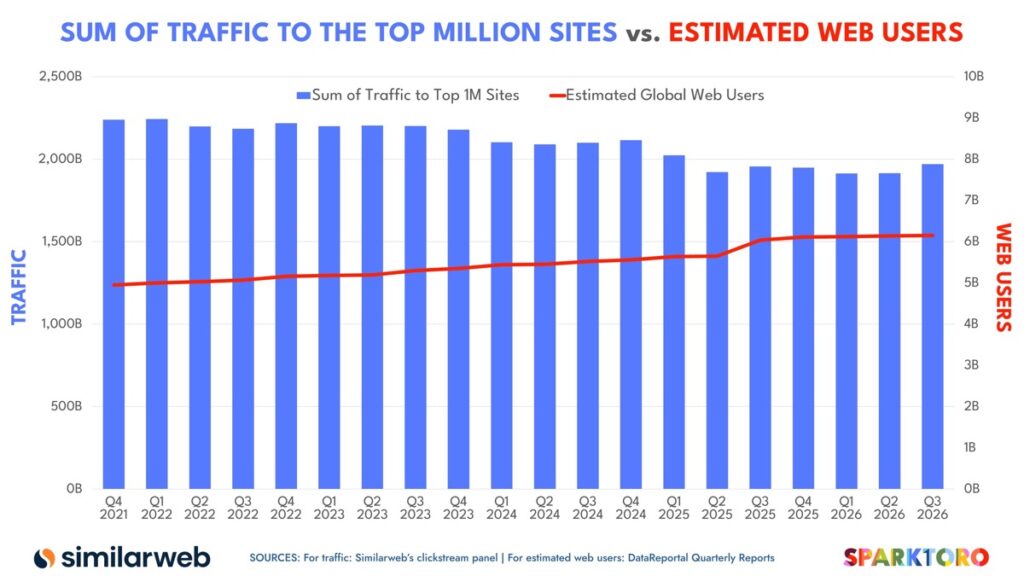
Traffic to the top million websites was 1.970 trillion visits in the third quarter of 2026, which is 12.2 per cent below the 2.243 trillion peak in the first quarter of 2022. SparkToro published those Similarweb figures on its own blog, and the number that matters more for anyone running a site sits in the middle of the report, where visits fall while the number of people online keeps rising.
What the Similarweb panel shows between 2022 and 2026
The panel counted total visits to the top million domains every quarter from 2021 to 2026, split by site rank. Total visits peaked in the first quarter of 2022, bottomed in the first quarter of 2026 at 1.914 trillion, and recovered to 1.970 trillion by the third quarter of 2026. The bottom was 14.7 per cent below the peak and the latest quarter is 12.2 per cent below it.
| Quarter | Visits to top million sites | Estimated web users | Visits per user |
|---|---|---|---|
| Q1 2022 | 2.243 trillion | 5.00 billion | about 449 |
| Q1 2026 | 1.914 trillion | 6.12 billion | about 313 |
| Q3 2026 | 1.970 trillion | 6.15 billion | about 320 |
The visits per user column is my arithmetic, from dividing SparkToro’s two series. It is the part of the report a site owner feels, because 12 per cent fewer visits spread across 23 per cent more people is a much larger loss per person than the headline suggests.
The share by site rank barely moved
Rand Fishkin started from the theory that the largest sites were taking more of the traffic. The data would not carry it. Search Engine Journal’s read of the share chart puts the top 100 sites at about 33 per cent of visits at the start of the period and about 36 per cent at the end. Fishkin calls that stagnation rather than hoarding.
That finding removes the easy explanation. Smaller sites did not shrink because one group ate their share. Every band lost visits at roughly the same rate, so the cause sits in how often people open a browser at all. I have written about the change to AI Mode’s default model as one candidate, and about the referrer data Google started sending as the way to see it in your own reports.
Visits per person fell faster than total visits
DataReportal’s user estimates in the report run from 4.95 billion in the last quarter of 2021 to 6.15 billion in the third quarter of 2026. SparkToro puts the fall in visits per user at 29.2 per cent. My division of the two series gives 449 visits per person in the peak quarter and 320 in the latest one, a drop of about 129 visits per person per quarter.
One caution sits inside that series. The user estimate jumps from 5.65 billion to 6.04 billion between the second and third quarters of 2025. DataReportal attributed that jump to revised reporting from India and China rather than to hundreds of millions of new users in 90 days. Any per-user figure that crosses that quarter is comparing two measuring sticks. Total visits do not depend on the estimate at all.
3 checks that tell a market drop from your own
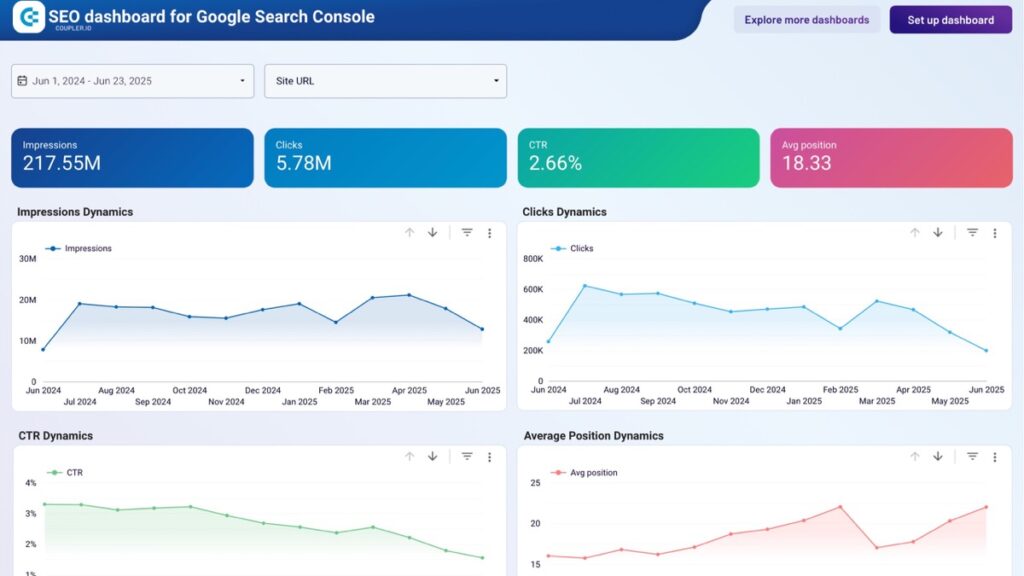
- Read impressions before clicks. If impressions hold and clicks fall, the change happened above your site and a page rewrite will not fix it.
- Split brand from non-brand queries in Search Console. A fall in non-brand queries points at the market, and a fall in brand queries points at you.
- Ask whether your audience moved into an app. The panel counts browser traffic on desktop and mobile only, and Fishkin says consolidation is probably stronger inside apps than it is on the web.
The 24 per cent in the URL is the old figure
SparkToro’s post URL still reads fallen-24-in-5-years, and the first version of the article carried a graph with wrong data in it. Fishkin said on 10 November that the earlier version had an incorrect graph, and the figures were corrected. The headline on the page now reads 12 per cent while the address still reads 24, so the page disagrees with itself.
So anyone citing a 24 per cent fall today is quoting a number the author has withdrawn, usually because they read a headline instead of the table. The figure to use is 12.2 per cent from the peak to the third quarter of 2026, and it has the advantage of being the one headline number that does not depend on the user estimates.
What the number is good for
It is global context, not a benchmark for one site in one market. The panel is worldwide, has no regional split, and does not state its own size, so a Jaipur publisher cannot read 12 per cent off it and apply it to a traffic report.
Two limits belong in the same conversation. The panel counts browsers, so a brand that most people reach through an app is not measured here at all.
The numbers are also worldwide. Fishkin writes that traffic to sites in Asia and Africa may have grown while sites in the United States, the United Kingdom and the European Union fell, which is the opposite direction from the story most people tell.
What it does is set the tone of a conversation. If a client’s organic clicks are down 15 per cent this quarter, the honest answer is that the open web is down about 12 per cent from its peak. The first job is to find out whether their pages lost anything beyond that. The Digital Marketing hub keeps the reporting work in one place, and the note on why most blog posts never get cited explains the part of this shift that a good page can still win.