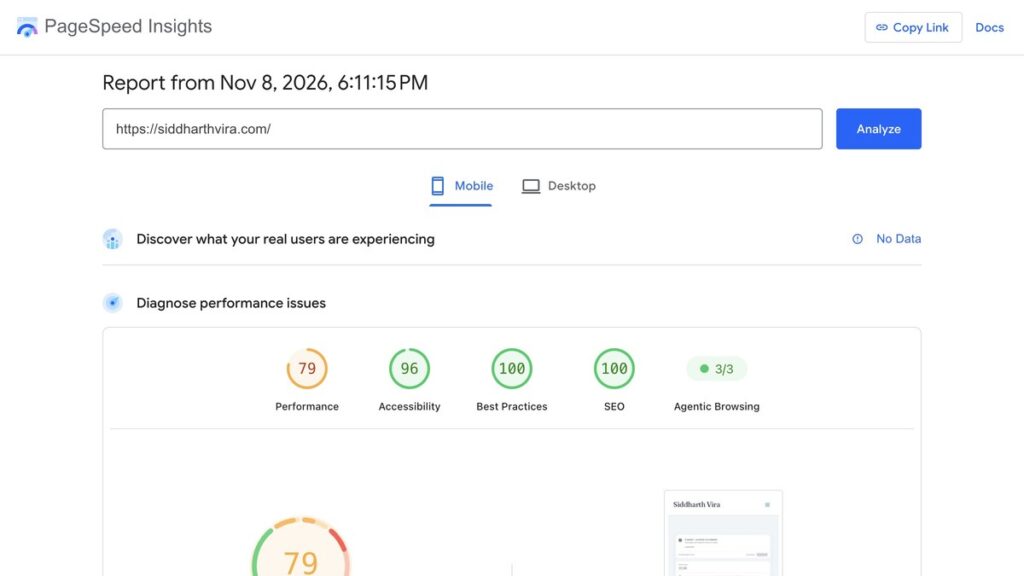
A page can gain or lose PageSpeed points while its code sits untouched, and that is what happened at the end of October 2026. Lighthouse 13.6.0, released on 27 October, changed the simulation behind the lab score, so a report taken before the update and a report taken after it are not measuring the same thing.
What shipped on 27 October 2026
Lighthouse is the open source tool that produces the performance, accessibility and best-practice scores you see in Chrome DevTools and in PageSpeed Insights. Version 13.6.0 landed on 27 October 2026, and the release notes say it is expected in the DevTools of Chrome 159 and to reach PageSpeed Insights within a week.
The release notes for 13.6.0 list every change in the version. The headline one is the loading simulation, which Lighthouse calls Lantern. It estimates how a page would load on a slower connection without actually slowing the connection. Version 13.6.0 upgraded the trace engine behind that model and changed how individual requests are treated, which is the part that moves scores.
Why a score moves when the page does not
Google’s Barry Pollard said the new simulated First Contentful Paint and Largest Contentful Paint are more accurate and will generally show better results, with JavaScript-heavy sites most likely to see a difference. Search Engine Journal summarised the PageSpeed Insights score change in its 7 November 2026 roundup.
That last part is the useful bit for anyone who works on a site built on a JavaScript framework. A page that depends on scripts to draw its main content was being estimated with a coarser model, so it has the most room to move, in either direction.
What changed inside the simulation
Four changes in the release notes explain most of the movement. Each one is about how Lighthouse decides which requests block the first paint, which is the single biggest input into a simulated load.
| Change in Lighthouse 13.6.0 | What it affects | What you would notice |
|---|---|---|
| Render-blocking status now read from the browser protocol for each request | Which requests the simulation treats as blocking | A page can gain time it never actually saved |
| Fetch priority used as the fallback when no render-blocking label exists | Order in which requests are scheduled | Score shifts on pages with lazy or deferred assets |
| HTTP/3 connections modelled as multiplexed | Estimated transfer time on modern hosting | Sites already on HTTP/3 look slightly different |
| Simulated LCP breakdown calculations fixed | The LCP estimate itself | A jump on pages with text LCP in the same frame as the first paint |
Read the table as a list of reasons a score can move for free. None of them describe a change you made, and all of them change the number.
Lab data and field data answer different questions
PageSpeed Insights shows two things side by side, and people quote whichever is kinder. The lab section is one simulated visit by one tool. The field section is real Chrome users on real devices over the last 28 days, collected through the Chrome User Experience Report.
A lab score answers whether the page has a technical problem you can fix. Field data answers whether people are actually waiting. When the two disagree after an update, trust the field data for how the site performs and the lab report for what to fix, and never mix a lab improvement with a field number in the same claim.
How to compare two reports honestly
The comparison is where the false conclusion creeps in, so the method matters more than the tool. Five rules keep a before-and-after honest.
- Match the version. A Lighthouse report names its version. Two reports from different versions are two different tests, and the difference may be entirely the tool.
- Match the device. Mobile and desktop run different throttling settings. Switching the toggle between runs is the most common way to invent a 20-point win.
- Match the run count. Simulated scores vary between runs on the same page. Take three and compare the range, or you are reporting noise.
- Compare field data first. If the real-user numbers did not move, the page did not get faster for anybody, whatever the lab score says.
- Record the version in the report. A line saying which Lighthouse version produced a number is what lets somebody check it in three months.
The same discipline applies to the rank trackers, where a poisoned result set can look like a ranking drop. 5 checks for rank trackers reporting poisoned Google results runs the same argument on a different dataset.
What to write in a client report this month
If a client’s score improved across the update, say so plainly and put the version next to both numbers. An unearned improvement is worse than a flat month, because the next release can take it back and the number you were trusted for disappears.
If a score dropped, check the version before the alarm. A drop that arrives with a tool release and no field-data movement is a change in the measuring stick.
A score compared across two versions proves nothing
A performance claim is only as good as the test behind it, and a test that cannot fail proves nothing. A test that cannot fail proves nothing about your SEO is the longer version of that argument, and a score compared across two tool versions is the exact shape it warns about.
The search and SEO hub collects the posts on measurement and technical checks. If the drop turns out to be real rather than simulated, the next thing to rule out is downtime. What a 503 status code does to your rankings covers that, because a slow site under maintenance and a slow site on a bad host look identical in a chart.
One habit worth keeping. Keep the date and the Lighthouse version in the filename of every saved report. It costs four words and it is the difference between a trend and a coincidence.