Three capabilities that were already in the Search Console interface reached the Search Analytics API on 16 November 2026: a branded query classification, web multimodal reporting, and filters that take several countries or devices in one request. The release note is short and the documentation is where the work is. Four limits decide whether a dashboard can use any of it.
If you pull Search Console data into a spreadsheet or a BI tool, these were the three joins you had been faking with regex and separate calls. Each one now carries a condition.
What shipped on 16 November 2026
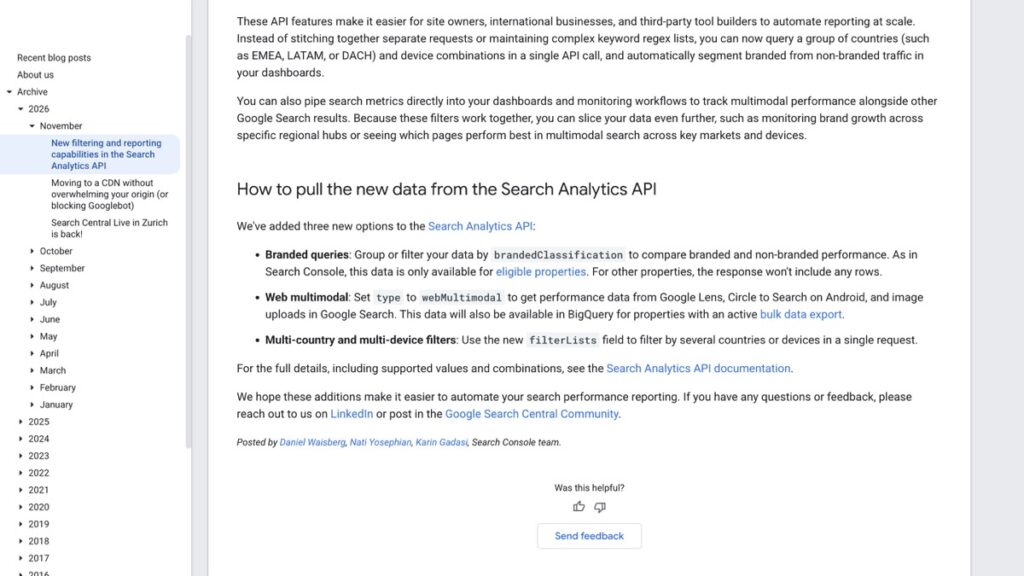
Google’s announcement lists three additions to the query endpoint, and all three were live in the Performance report first.
- Branded queries. You can now group or filter by
brandedClassification, the same switch the Performance report added a year ago. - Web multimodal. Setting the result type to
webMultimodalreturns performance from Google Lens, Circle to Search on Android and image uploads in Google Search. - Multi-value filters. A new
filterListsfield accepts a list of expressions per dimension, so several countries or several devices go into one request.
The pitch from Google is fewer stitched requests. The reason it matters for an Indian agency is different. A branded versus non-branded split has been the first thing a client asks about since AI answers started eating brand searches, and until this week it lived in the interface rather than in the numbers you can schedule.
Branded queries come with a property condition
The brandedClassification filter takes only the equals operator and two values, BRANDED and NON_BRANDED. Three restrictions sit around it.
It cannot be combined with a query filter in the same request. Data starts from 21 February 2026, so any comparison that reaches further back has a hole in it. And it is available only for top-level properties with enough query and impression volume, which means an ineligible property returns rows without the field rather than an error.
That last one is the trap. A scheduled report on a small client property will keep returning numbers, and the branded column will simply be empty or missing. Test one request per property before you build the chart, and treat an empty response as a property answer rather than a syntax mistake.
Web multimodal is a fourth result type
The type field used to cover web, image, video, news, Discover and Google News. It now also takes webMultimodal, which covers Lens, Circle to Search on Android and image uploads in Google Search.
The default is still web, and the documentation says plainly that the default does not include Discover or Google News results. So a report labelled Search performance that never sets type has been describing the All tab alone for years, and now there is one more tab-shaped surface outside it.
Properties with an active bulk data export also get multimodal rows in BigQuery. If you already query BigQuery, check the export before adding a second pipeline into the API.
filterLists replaces the loop
The new field sits inside dimensionFilterGroups and takes a dimension plus a list of expressions. One group asking for country IN (India, United Arab Emirates, Saudi Arabia) and another for device IN (Mobile, Desktop) now returns the slice in a single call, and all filter groups must match for a row to come back.
The row limit is where this bites. rowLimit runs from 1 to 25,000 and defaults to 1,000, and startRow is the offset you page with. A widescreen report grouping by page, country and device for a client with a few thousand URLs will hit 1,000 rows without saying so, and the totals will look almost right.
Four limits decide whether a report is correct:
| Limit | What it means in practice |
|---|---|
brandedClassification is equals only | You cannot ask for branded queries that contain a word. Split first, filter second. |
| No query filter with branded | A query-level branded report is two requests, not one. |
| Data from 21 February 2026 | Year-on-year branded comparisons stop at that date. |
rowLimit defaults to 1,000 | Page with startRow, or your totals are the top 1,000 rows. |
What to run this week
- Test eligibility on every property you report on. Send one request with
brandedClassificationgrouped by month and see whether rows return the field. Ten minutes, and it stops a broken chart later. - Rebuild one existing stitched report. The country or device loop you already run is the cheapest test of
filterLists, and the row count tells you whether paging is needed. - Check the multimodal surface. Pull 28 days of
webMultimodaland compare it with the web total. If the numbers are close to zero, that property has not started receiving those visits and the report can wait.
Keep the interface as the check rather than the source. The branded filter and the multimodal reporting both look the same in Search Console, so a screenshot from the UI is still the fastest way to confirm the API agrees.
The date range is the other thing to watch. Dates are sent and returned in Pacific time, so an Indian month boundary is a day off, and the new referrer values already show how much a session count moves when the definition shifts. Before this goes into a client dashboard, read what to do before comparing traffic across the November core update, because a new dimension on top of an unsettled month produces a story rather than a measurement.
These filters sit on the same machinery the Indexing API’s approval change touched, and the pattern is the same. The endpoint gains a capability, the documentation adds a condition, and the condition is the part that decides the answer. More of this beat is in the search and SEO hub, including the checks that show two pages fighting for one query.