Only 6.9 per cent of ChatGPT conversations in the largest opt-in panel published so far showed any purchase intent, and 87.9 per cent of the replies named no brand, product or business at all. SparkToro published the analysis on 17 November 2026 from data supplied by Verso, a tool that reads ChatGPT history from users who connect their account. For a team deciding what AI visibility work is worth, 6.9 is the least useful number in the report. The method and the other figures are what you can act on.
What the Verso panel measured
Verso tracked 41,961 complete ChatGPT conversations from 12,321 people in the United States between 1 January and 29 October 2026, which is 118,163 prompts. SparkToro removed the heaviest 131 users before analysing anything. They were 1 per cent of the panel and sent 21 per cent of every prompt, so leaving them in would have described a small group of power users. The remaining panellists averaged 9.9 prompts across ten months.
Each conversation carried one label, assigned by Claude working from a written codebook of 34 intents grouped into 12 categories. The model read the chat title, up to six user prompts, the opening of the first few replies, and any product cards or bolded names. A second coder recoded a random sample blind, and the two agreed on 90 per cent of category labels and 97 to 99 per cent of brand tags.
The panel is opt-in and skews younger, female and lower income. Weighting the 9,675 panellists who had demographic records to 2024 US Census targets moved no category by more than 1.4 percentage points. Most panelists were recorded on phones, and API requests are not in the dataset at all.
Three numbers that divide by different things
The report is careful about its method and loose about its arithmetic, and the looseness is where a client deck goes wrong. Four figures describe brand interest in the same dataset, and each one divides by something else.
The 6.9 per cent is conversations with purchase intent. The 12.1 per cent is responses that named at least one brand. A line in the takeaways says 12 per cent of ChatGPT usage is part of the buyer journey, and that sentence borrows the response figure for a claim about conversations. On the prompt side, 86.7 per cent never asked for brand information, 6.6 per cent asked about several brands and 6.7 per cent about a single one.
So quote 6.9 per cent for demand, 12.1 per cent for brand mentions inside answers, and 13.3 per cent for prompts that touch a brand at all. They are three different measurements of one dataset, and no deck should mix them into a single claim.
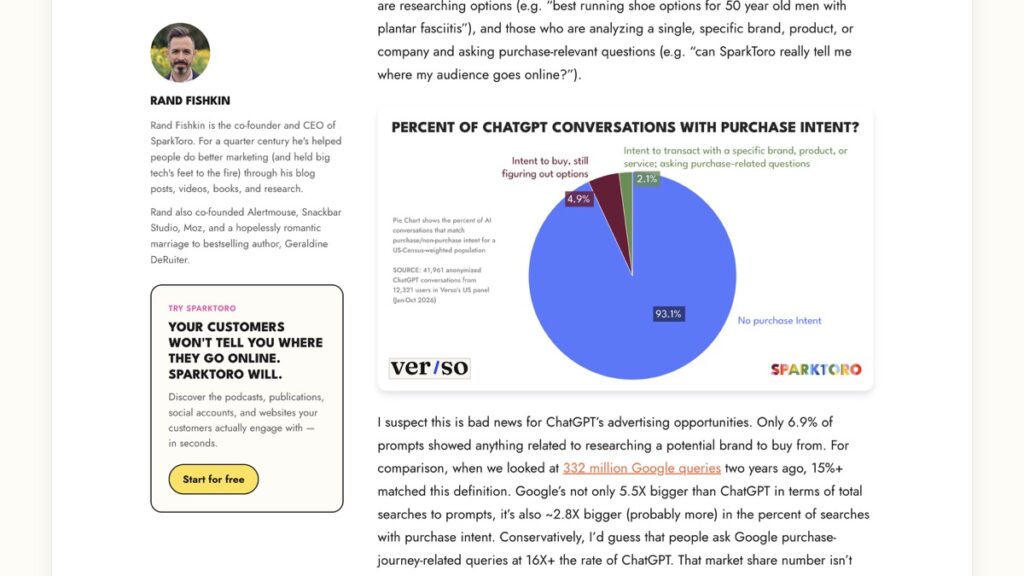
Three labels cover buying behaviour, and the split inside them matters more than the total:
| What the conversation was doing | Share of conversations |
|---|---|
| No purchase intent | 93.1 per cent |
| Planning to buy, still comparing options | 4.9 per cent |
| Asking about one specific brand, product or service | 2.1 per cent |
The two buying rows add to 7.0 per cent and the whole table adds to 100.1, because the published figures are rounded. The headline in the report is 6.9 per cent. The third row is the only place a question about one named brand is separated from general research.
The published summaries do not match the report
Two accounts of the same data disagree on its own category figures. SparkToro’s text lists images and visual design at 16.1 per cent of conversations, information and entertainment at 14.0 per cent, writing at 11.9 per cent and shopping at 5.7 per cent. Search Engine Journal’s write-up on 17 November 2026 prints 17.6, 14.4, 12.7 and 5.3 per cent, and says its figures follow the report’s chart.
Neither number is wrong. One is the chart, the other is the prose, and the gap of up to 1.5 points is larger than the movement most agencies will ever show a client. Open the primary study, take the figure from its own method section, and cite the version you read.
What an Indian team should check first
Nothing in this panel is Indian. It is a US opt-in panel of consumer use, and the report says plainly that it describes what people ask better than how much they use the tool. Three checks beat importing the percentage.
- Read your own referral rows first. GA4 misses four kinds of AI visit, and the values in Google’s new referrer page change how those sessions are counted. Your own 90 days beat somebody else’s 41,961 conversations.
- Decide which denominator the retainer is priced on. A mention inside an answer and demand inside a prompt are two products, and this panel prices them at 12.1 and 6.9 per cent of a much larger base.
- Put the volume where Google is. Fishkin’s own conclusion is that AI visibility matters because of AI Overviews and AI Mode rather than ChatGPT, and that tracking ChatGPT without tracking Bing is hard to defend.
That third point is worth arguing about. On this panel ChatGPT carries about a tenth of Google’s query volume, and a smaller share of buying intent. Google’s push into AI answers is the part that reaches an Indian audience at scale, as the November change to the AI Mode default showed.
What the panel cannot tell you
Four gaps are stated and one is not. The stated ones are the phone-heavy capture, the missing API traffic, the US-only sample and the opt-in skew. The missing one is an agreement figure for purchase intent. The report gives 90 per cent for categories and 97 to 99 per cent for brand tags, then reports no separate agreement rate for the purchase-intent labels that the headlines use.
Fishkin also estimates that API traffic may be half to three quarters of all ChatGPT usage, and that it looks nothing like consumer use. The panel describes the consumer slice well and says almost nothing about the work slice, which is where most B2B search demand sits.
Read 6.9 per cent as a floor for consumer buying behaviour in one country, keep the denominator attached, and check your own referral data before it enters next quarter’s plan. The full report is at SparkToro, the AI search and getting cited hub collects the rest of this beat, and what happens when a ChatGPT ad wins an auction covers the other half of the same question.